
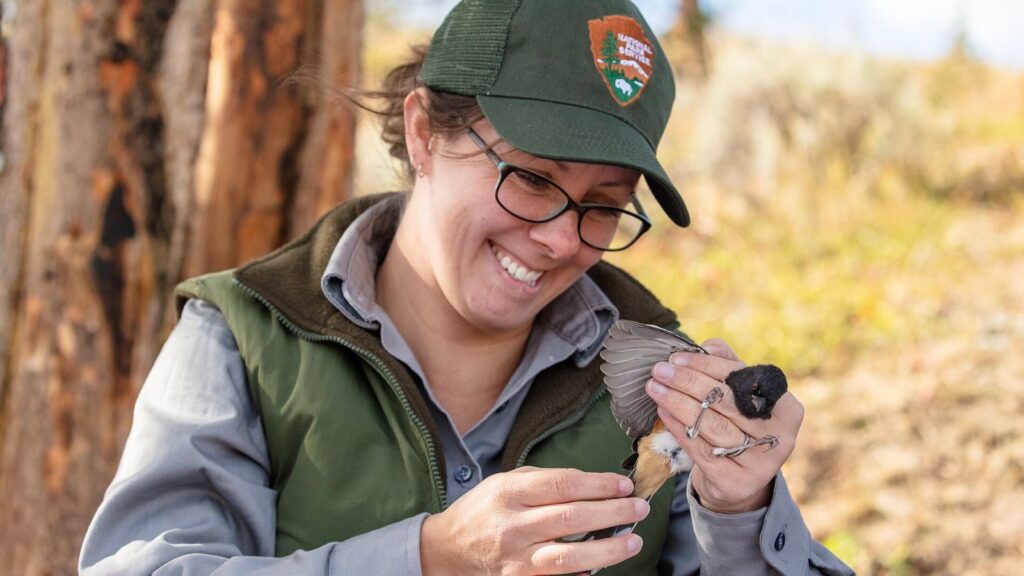
To conduct a bird survey, select an appropriate method like point counts or transects based on your habitat. Start 30 minutes before sunrise and avoid rainy or windy conditions. Bring quality binoculars, a notebook, and a GPS device to record species, numbers, and locations. Make at least six visits during breeding season (March to July), spacing them 2 to 3 weeks apart. Document weather conditions for each survey. Proper planning guarantees your data will contribute meaningfully to avian population monitoring.
Bird surveys are only one branch of a much larger family of field techniques. If you are deciding between point counts, transects and territory mapping, this survey method finder compares 188 methods across 14 taxon groups.
Key takeaways
- Match the method to the habitat: line transects on open, walkable ground, point counts in dense cover, acoustic recorders where birds are heard and not seen.
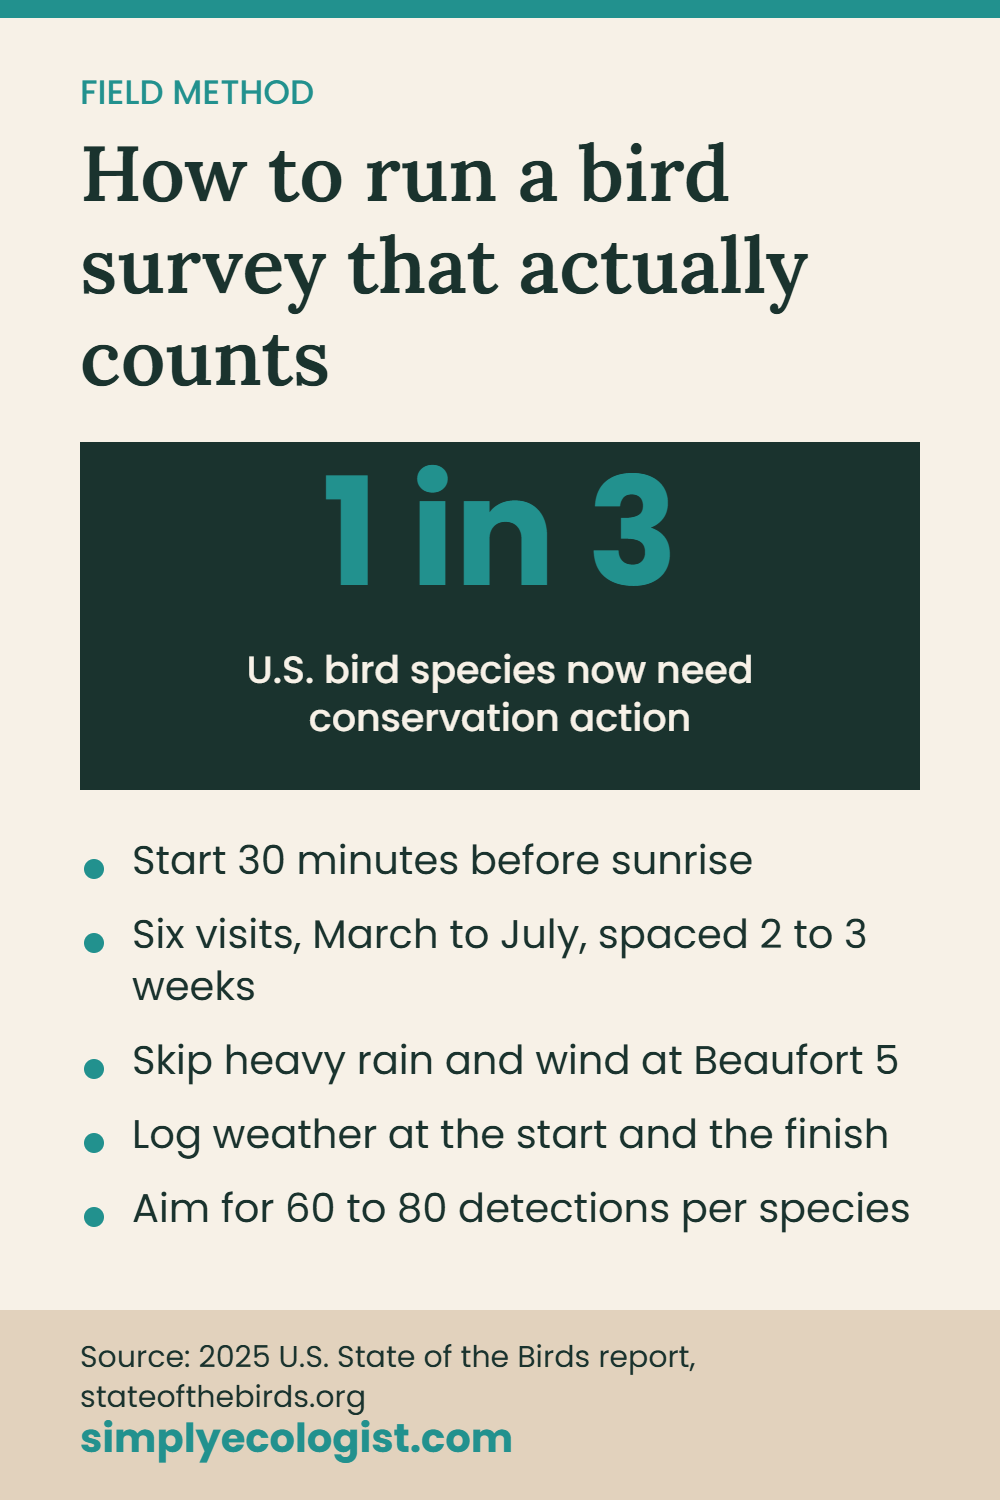
- Start 30 minutes before sunrise and finish by mid morning, around 11am.
- UK guidance asks for six visits from March to July, spaced 2 to 3 weeks apart. The US Breeding Bird Survey uses one roadside route run once each June.
- Stop at Beaufort 5 wind, which is 29 to 38 km/h, and at anything heavier than light drizzle.
- Log the weather at the start and the finish of every visit, and aim for 60 to 80 detections per species before trusting a distance sampling estimate.
State of the Birds (2025)
According to the 2025 U.S. State of the Birds report, bird declines continue across almost every habitat, and a third of U.S. species now need conservation action. Every bit of backyard habitat counts.
Which Bird Survey Method Should You Choose?
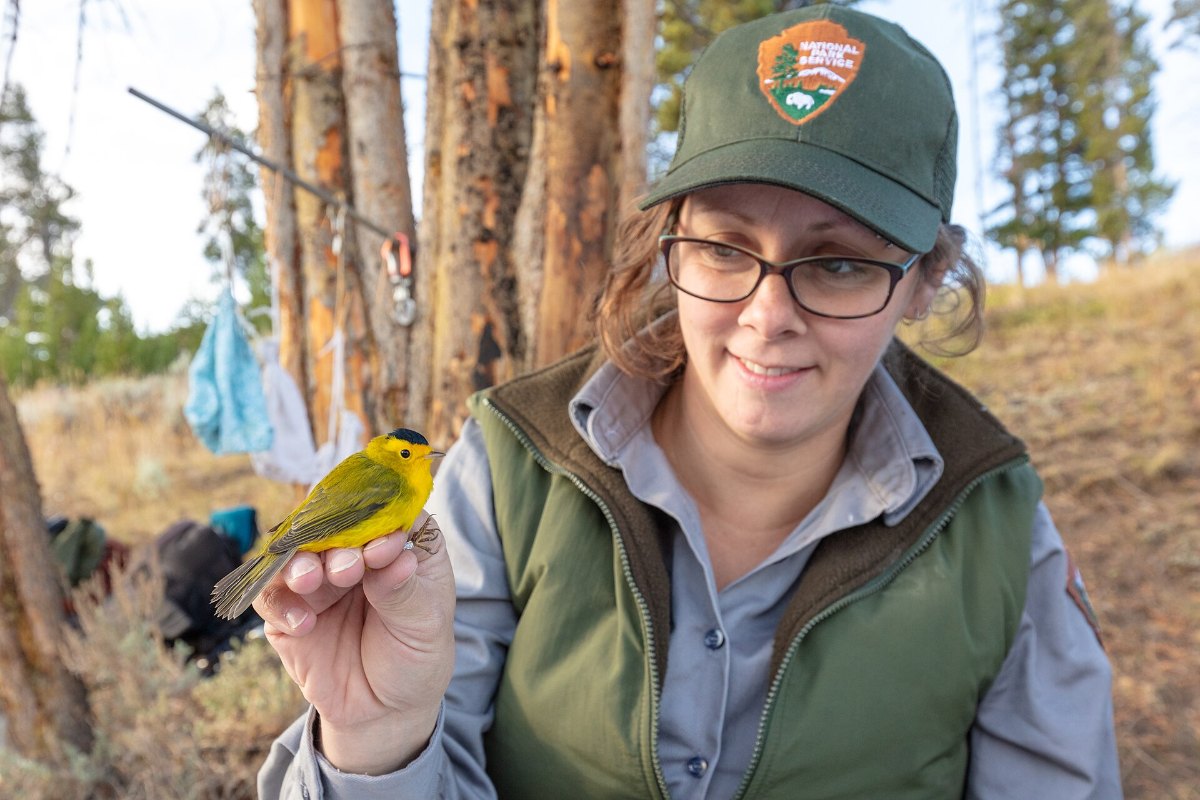
Match the method to the habitat: line transects for open or walkable ground, point counts for dense cover and broken terrain, and acoustic recorders for birds you will hear far more often than you see. When planning a bird survey, selecting the appropriate method considerably impacts your results and efficiency. Consider your specific objectives, habitat type, and target species before beginning.
For wetland or pond areas, visual methods like direct observation will detect more species than mist netting. If you’re monitoring nocturnal or secretive birds, ecoacoustic surveys (EBS) recorded 50 to 59% more species than walked transects alone in two English Midlands trials, so they are worth the cost where birds are heard far more often than seen.
Choose transect surveys for large, open areas where you can walk unobstructed paths. For dense vegetation or difficult terrain, point counts will serve you better. Under UK bird survey guidelines, a minimum of six visits is recommended for breeding season surveys. The US Breeding Bird Survey works differently, with a single roadside route run once each June, so check the standard that applies where you are before you fix your effort.
While mist netting provides detailed physical data, it’s less effective for simple presence/absence studies. The same rule holds across taxa: the method has to suit the animal, which is why a mammal survey leans on camera traps and footprint tunnels rather than a dawn count.
Remember that phylogenetically related species often have similar detection probabilities. Birds with predictable habitat use are ideal candidates for camera monitoring, while species with distinctive calls work well with acoustic methods.
Method choice shows up in the counts, not just in the theory. In a 2023 comparison at Cloudbridge Nature Reserve in Costa Rica, 90 point counts and 90 line transects were run in the same montane forest over one spring. The transects averaged 7.5 species and about 17 individuals per survey; the point counts averaged 5.7 species and about 12 individuals. In closed tropical forest, walking beat standing still, which is the opposite of what a lot of guidance assumes.
| Method | Best for | What it misses |
|---|---|---|
| Line transect | Open, walkable habitat; larger areas; non vocalizing and grassland species | Birds flushed ahead of you; anything in terrain you cannot walk straight through |
| Point count | Dense vegetation, broken terrain, repeatable fixed stations | Species that move between points; a smaller area per unit of effort |
| Acoustic recorder (EBS) | Nocturnal, secretive and hard to see species; unattended coverage | Silent birds; anything outside the microphone range; needs processing time |
| Mist netting | Biometrics, ringing, age and sex data, condition | Overkill for presence and absence; needs a licence and a trained ringer |
| Camera monitoring | Species with predictable habitat use; nests and feeding stations | Anything outside the frame; poor for wide ranging species |
Essential Equipment for Bird Surveys
Equipped with the right survey method, you’ll now need proper tools to execute your bird survey successfully. Quality optics are fundamental. Choose binoculars with 7 to 10x magnification and 25 to 42mm objective lenses for stability and brightness. For distant observations, consider a spotting scope or lightweight monocular.
Document everything meticulously using waterproof notebooks and GPS apps to record locations. Bird identification apps like Merlin can verify species when you’re uncertain. Recording individual nest information on separate notebook pages helps maintain organized data for each bird species you encounter.
Don’t forget basic measurement tools: tape measures for nest heights and tripods to stabilize your optics during extended watches. Dress in camouflage to minimize disturbance, and carry environmental sensors to track habitat conditions. For remote surveys, Personal Locator Beacons provide vital safety backup.
Advanced surveys benefit from thermal imaging devices to detect cryptic species and automated cameras for continuous monitoring without human presence.
Remember to pack rechargeable batteries. Power reliability is essential for digital equipment in the field.
| Kit | What to look for | Why it matters |
|---|---|---|
| Binoculars | 7 to 10x magnification, 25 to 42mm objective | Brightness at dawn without the weight that makes your arms shake |
| Spotting scope | Tripod mounted, 20 to 60x | Open water, estuaries and anything you cannot approach |
| Field notebook | Waterproof paper, one page per station | Pencil still works in rain; a wet phone does not |
| GPS or phone app | Records a position without a signal | Every detection needs a location to be reusable later |
| Rangefinder | Accurate to a metre at 100m | Distance sampling is only as good as its distances |
| Audio recorder | Omnidirectional, timestamped | Settles the calls you cannot place in the moment |
Planning Your Survey Routes and Points
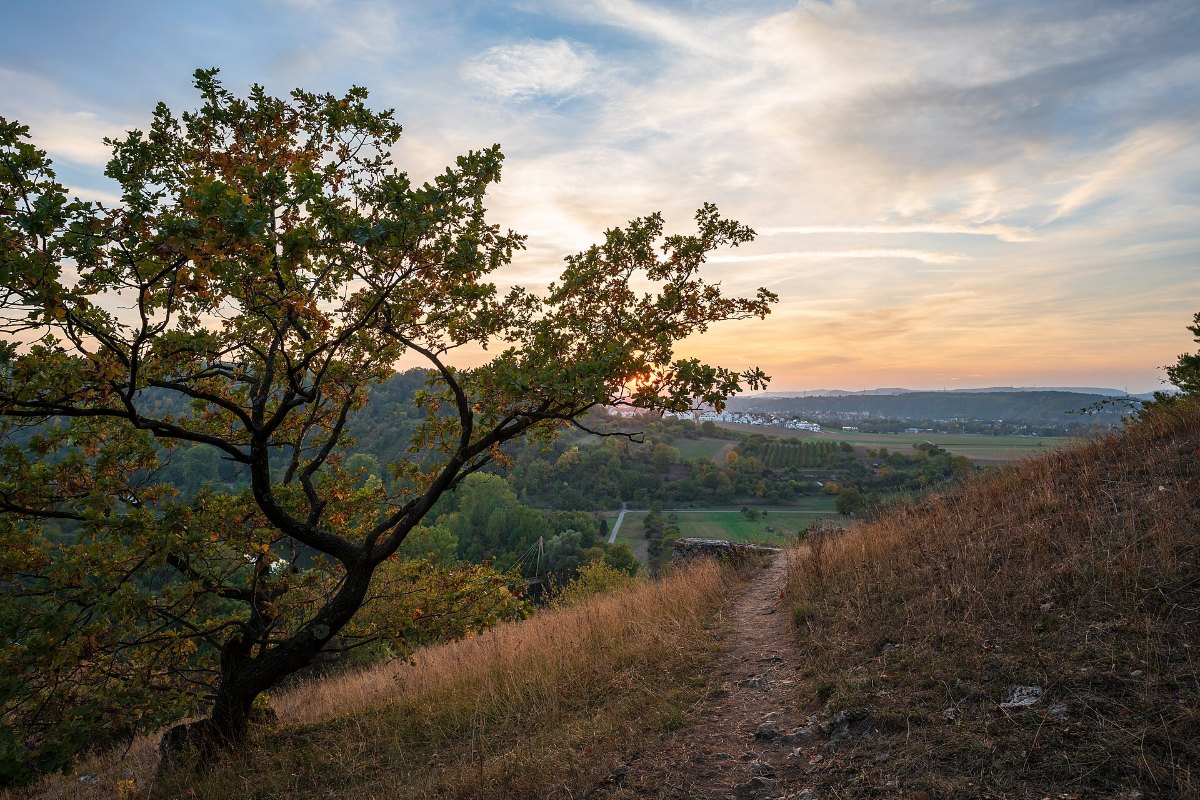
Thorough planning of your survey routes and points forms the foundation of reliable bird monitoring data. In the UK, the simplest start is a British Trust for Ornithology BBS square, a 1 km grid square carrying two predefined parallel transects that you modify for seasonal changes. In the US, the equivalent is a North American Breeding Bird Survey style roadside route, or a stratified grid you lay out yourself across the habitat types on site. Either way the principle is the same: fix the geometry before the first visit so the data stays comparable between years. Scout your routes beforehand to confirm access permissions and identify potential obstacles.
Select sites using random or systematic sampling to avoid bias, and divide your survey area into standardized grid squares. Balance coverage across different habitat types to capture diverse species, and consider stratified sampling for areas with significant habitat variation.
For habitat specific surveys, align routes with relevant features, shorelines for wetland surveys or forest edges for woodland species. Planning of transect routes is essential for new sites prior to conducting your first survey visit. Always obtain written landowner permissions for private property access, and prioritize public rights of way when possible.
Maintain consistency by using fixed stop locations and timing your surveys seasonally. Document your routes thoroughly so they’re reproducible, ensuring your data remains comparable across years.
When Should You Run a Bird Survey?
Survey from 30 minutes before sunrise to mid morning, in the breeding season, on days without rain or strong wind. Timing your bird surveys correctly can mean the difference between thorough data collection and missed opportunities.
Plan to conduct breeding surveys between March and early July, with six evenly spaced visits to capture both early nesters and late arriving migrants.
Start your surveys 30 minutes before sunrise and conclude by mid morning (around 11 AM) when bird activity is highest.
For crepuscular species like nightjars, extend your observations into late afternoon or after dusk.
Schedule surveys 2 to 3 weeks apart, adjusting for seasonal progression.
Be flexible with timing if spring weather accelerates or delays breeding cycles.
Avoid surveying during precipitation beyond light drizzle, and stop once wind reaches Beaufort 5, which is 29 to 38 km/h or 19 to 24 mph.
For non breeding surveys, conduct four visits between November and February, particularly for wintering species.
Add specialized timing for early nesters (January to February) or late breeders (August to September) when these species are present in your survey area.
Record the date and time of all surveys, including weather conditions, to document any limitations that might affect your results.
Field Techniques for Accurate Bird Detection
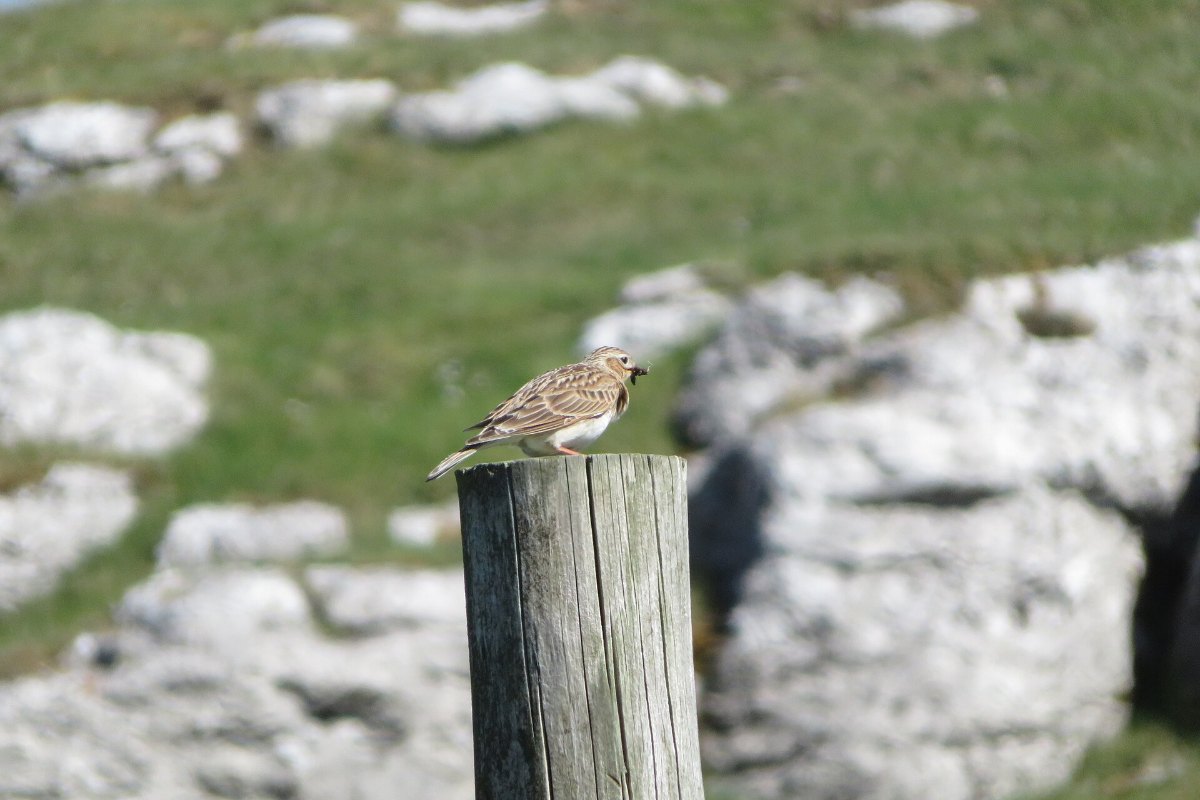
Achieving reliable bird survey results depends on mastering several field techniques that enhance detection accuracy. Choose appropriate sampling methods based on your habitat and target species. Random or stratified sampling works best in fragmented habitats, while line transects are ideal for non vocalizing birds like grassland species.
For identification, use regional field guides with localized information and high quality visuals. Pay close attention to habitat associations, plumage details, and distinctive flight patterns. Taking time to observe beak shapes and sizes can significantly aid in accurately identifying different species during your survey. Modern technology can considerably improve your data collection. YOLOv7 based detection systems with global attention modules achieve impressive accuracy rates for species identification.
Distance sampling with rangefinders helps estimate bird density and corrects for detection probability variations. When working across different habitats, stratify your approach to avoid high variance in your data.
The combination of traditional observation skills with advanced tracking tools like DeepSORT ensures thorough and scientifically sound survey results.
What Weather Is Too Bad to Survey In?
Stop surveying in anything heavier than light drizzle, in fog, or once wind reaches Beaufort 5 at 29 to 38 km/h. Weather conditions shape bird survey outcomes and can make the difference between reliable data and questionable results.
Begin surveys 0.5 to 1 hour before sunrise to capture peak dawn chorus, concluding by mid morning when activity diminishes. For nightjars or owls, conduct additional evening surveys.
Avoid surveying during rain, as precipitation notably reduces detectability. Even light drizzle compromises results, while fog affects both visual and auditory detection. Wind presents another essential limitation. Stop surveying once wind reaches Beaufort 5, which is 29 to 38 km/h or 19 to 24 mph, because wind at that strength masks song and suppresses detectability.
Temperature extremes (below freezing or above 35°C) suppress bird activity.
| Condition | Go or no go | Why |
|---|---|---|
| Beaufort 0 to 3, up to 19 km/h | Survey | Song carries normally |
| Beaufort 4, 20 to 28 km/h | Survey with caution | Detection of quiet song starts to drop |
| Beaufort 5 and above, 29 km/h and above | Stop | Wind masks song and birds sit tight |
| Light drizzle | Survey with caution | Detectability already reduced |
| Rain heavier than drizzle, or fog | Stop | Both visual and auditory detection collapse |
| Below freezing or above 35 degrees C | Expect poor results | Activity is suppressed at both extremes |
Record all weather conditions at your survey’s start and finish using standardized scales (Beaufort for wind, Okta for cloud cover). Document any mid survey weather changes that might affect your results, and maintain comparable conditions across multiple visits for reliable population indices.
How Do You Record What You See?
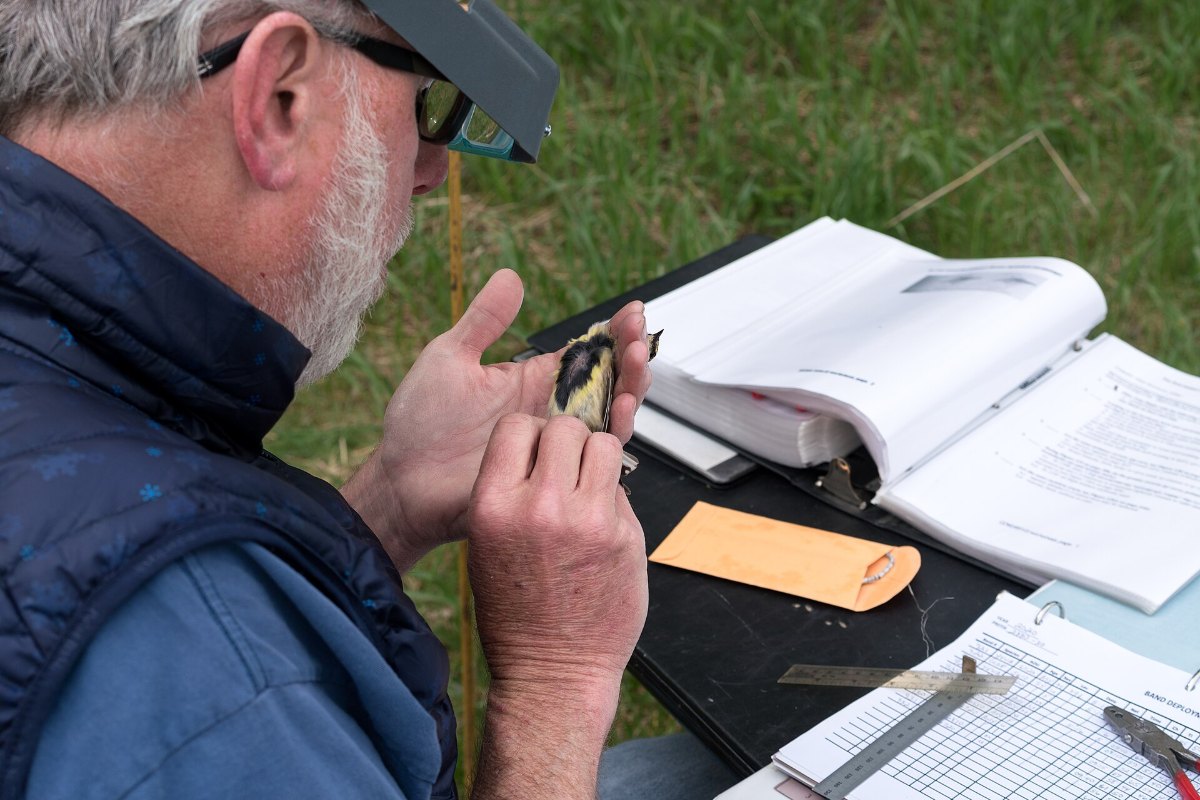
Record species, count, behaviour, habitat and a GPS position for every detection, and log the weather at the start and the finish of every visit. Accurate documentation forms the foundation of any credible bird survey, requiring both methodical recording practices and appropriate tools.
Carry a waterproof field notebook or digital device with a reliable bird identification app to record your observations in real time. Note each species’ name, number of individuals, behaviors, habitat, and precise location using GPS coordinates when possible.
Photography serves as invaluable visual evidence to support your findings, especially for rare species or unusual behaviors. Use a camera with telephoto capabilities, capturing multiple angles when feasible. These images can later verify identifications and provide context about habitat use.
Develop a consistent coding system for your notes to record behaviors efficiently: F (feeding), N (nesting), V (vocalizing). Consider making audio recordings of bird calls when visual identification proves difficult for similar looking species.
Don’t forget to document survey conditions including date, time, weather variables, and observer names. This metadata proves essential when analyzing results or defending your findings against potential challenges from the scientific community.
Understanding Distance Sampling Principles
Distance sampling forms the cornerstone of scientific bird population estimation, allowing you to calculate density without counting every individual in an area. This method relies on measuring perpendicular or radial distances from your transect line or point to each bird detected.
For reliable results, you’ll need to guarantee three critical assumptions: all birds on the transect line are detected, birds are recorded at their initial location, and distances are measured accurately. The fundamental formula calculates density by dividing the number of detections by your detection function and survey effort.
When surveying birds, you’ll need to account for their mobility using snapshot methods or specialized software like WildlifeDensity. Correct detection data collection requires immediate and thorough recording of information when birds are sighted. Aim for at least 60 to 80 detections per species to achieve statistically sound estimates.
Remember that birds farther from your transect are harder to detect, so you’ll model this declining detectability using functions like half normal or hazard rate curves.
Data Analysis and Population Estimation
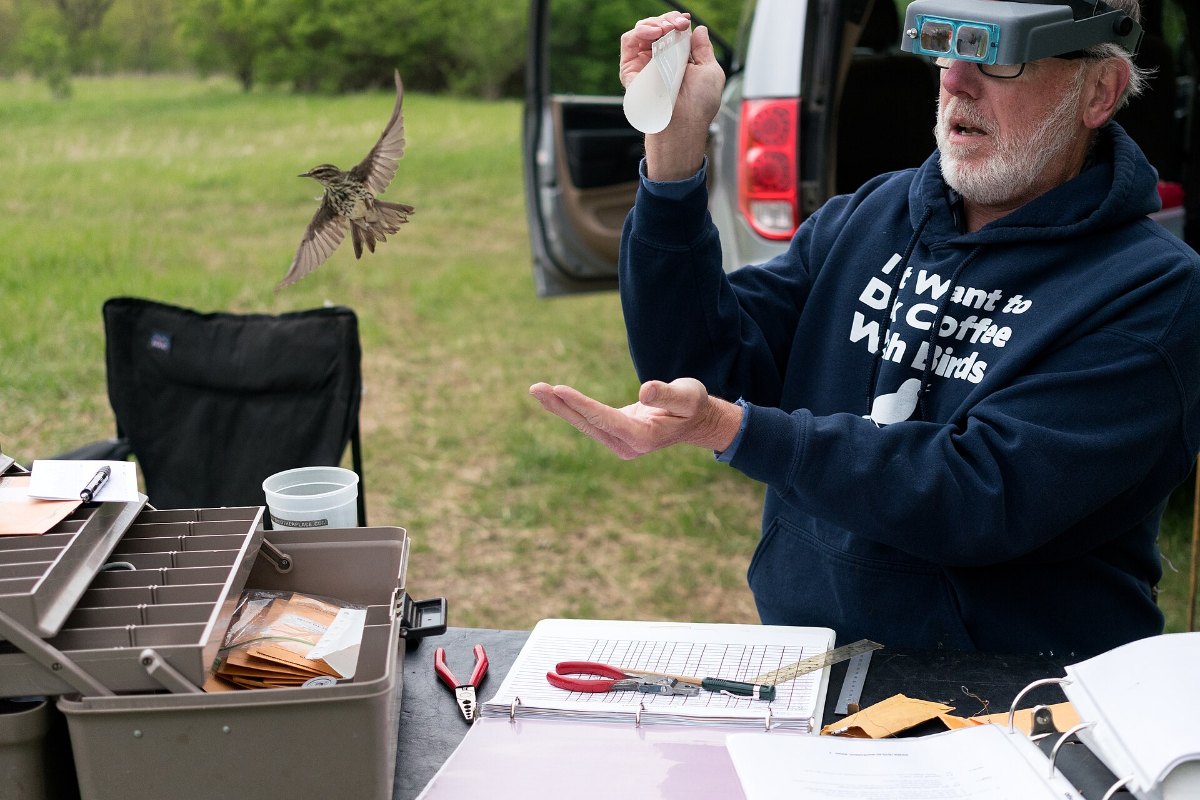
Once you’ve completed your fieldwork, transforming raw bird observation data into meaningful population estimates becomes your next critical challenge. Start by calculating Effective Area Surveyed (EAS) using detection distances to generate accurate density figures from all your observations.
Implement distance sampling to combine counts with detectability functions in DISTANCE software, fitting models like hazard rate or half normal curves. Use AIC to select the most parsimonious model for your data. Analyze detection curves to assess detectability patterns and test assumptions through goodness of fit tests.
For improved accuracy, incorporate double observer methods to estimate detection probability and adjust for missed birds. When dealing with habitat heterogeneity, stratify your sampling units and analyze variance across habitats.
Consider Bayesian frameworks for complex spatial analyses, especially with camera trap or acoustic data. Finally, validate your estimates by comparing results across methods and evaluating species discovery curves to account for rare species.
Common Challenges and Practical Solutions
Bird surveys rarely go exactly as planned in the field.
The scale of the problem is measurable. Where walked transects and fixed point counts have been run side by side in the same forest, the transects returned roughly a third more species per visit. Where acoustic recorders have been added alongside walked surveys, they added 50 to 59% more species again. Most of the variation in what a survey finds comes from the method, not from how hard the observer tries, which is worth remembering before you blame a thin dataset on the weather.
You’ll face detectability issues when birds hide visually or vocally, leading to undercounting. Combat this by using standardized methods like point counts with distance measurements or filtering data to include only experienced observers.
Weather and terrain obstacles are inevitable, and they are not unique to birds: a reptile survey is governed by the same weather windows with the thresholds reversed, because reptiles need the sun that suppresses bird song. Rain reduces bird activity while snow and remote locations limit access windows.
Schedule surveys for consistent conditions, typically dawn to mid morning, and plan logistics carefully for challenging terrain.
Observer bias threatens data quality, especially with community science inputs.
Implement training protocols, conduct pilot surveys to identify common errors, and use random sampling instead of “good habitat” site selection.
For reliable data, avoid sampling strategy pitfalls by using random or systematic approaches with sufficient sample sizes.
When working with threatened species with limited data, consider monitoring common species concurrently and integrating professional datasets with community science observations.
Establish rigorous benchmark data when possible to improve the accuracy of community contributed observations and better characterize changes in bird population abundance over time.
Header image: Jacob W. Frank, public domain, via Wikimedia Commons
References
- https://www.bto.org/our-science/projects/breeding-bird-survey/research-conservation/methodology-and-survey-design
- https://www.uwgb.edu/birds/nnf/program/methods.asp
- https://pmc.ncbi.nlm.nih.gov/articles/PMC7844255/
- https://www.ebcc.info/wp-content/uploads/2020/06/gregory-bird-census-and-survey-techniques.pdf
- https://bakerconsultants.co.uk/app/uploads/2023/10/Baker_Consultants_Bird_Bioacoustic_WhitePaper_20230625_final.pdf
- https://birdsurveyguidelines.org/methods/survey-planning/
- https://edis.ifas.ufl.edu/publication/UW164

Erzsebet Frey (Eli Frey) is an ecologist and online entrepreneur with a Master of Science in Ecology from the University of Belgrade. Originally from Serbia, she has lived in Sri Lanka since 2017. Eli has worked internationally in countries like Oman, Brazil, Germany, and Sri Lanka. In 2018, she expanded into SEO and blogging, completing courses from UC Davis and Edinburgh. Eli has founded multiple websites focused on biology, ecology, environmental science, sustainable and simple living, and outdoor activities. She enjoys creating nature and simple living videos on YouTube and participates in speleology, diving, and hiking.
From the shop
Gifts for people who love the wild
Wildlife themed t-shirts, notebooks, tote bags, bandanas and guides, designed by an ecologist.
Visit the shop