
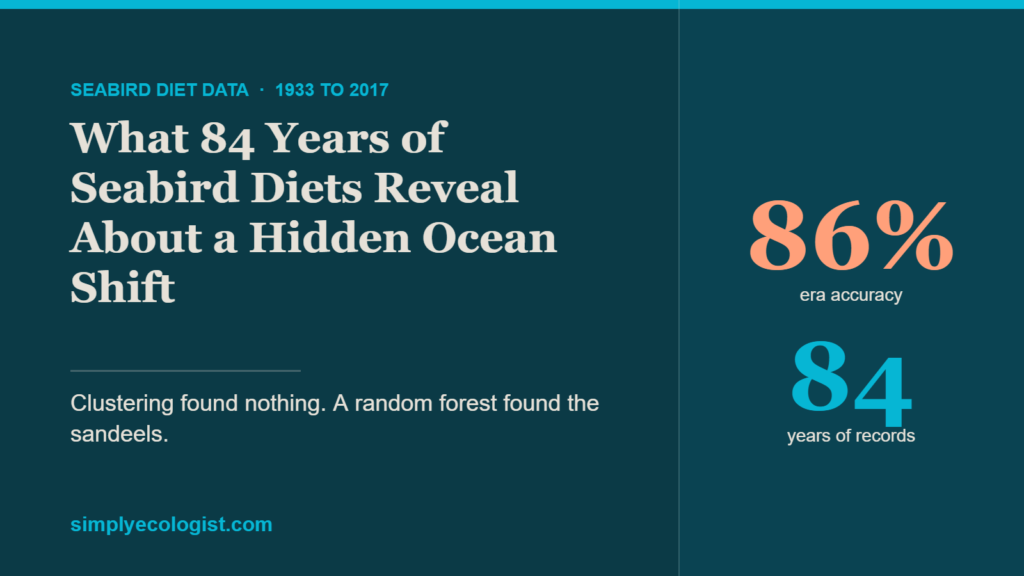
Somewhere in a filing cabinet, then a spreadsheet, then a public GitHub repository, sits one of the quieter kinds of scientific record. Not a dramatic survey, not a tagged whale swimming across an ocean. Just what seabirds ate, colony by colony, year by year, for 84 years.
I spent a day turning that record into a machine learning project, and what came out the other side surprised me. Two different questions, asked the same data, gave two different answers. One method saw nothing. The other saw a story that matches exactly what fisheries scientists have been documenting in the North Sea for decades.
Here is what 2857 diet records, ten seabird species and one very hungry fish taught me about reading biodiversity data as evidence, not just numbers.
The short version
- The data: seabirddietDB, 2857 published diet records from ten seabird species at 64 colonies around the British Isles, 1933 to 2017.
- Unsupervised clustering found nothing. The adjusted Rand index was 0.085 against predator species and 0.006 against a before or after 1990 split.
- A supervised model did. A random forest reached 86 percent held out accuracy against a 69 percent majority class baseline, with a five fold cross validated ROC AUC of 0.86.
- It leaned on sandeels, clupeids and gadids, the exact fish at the centre of the documented North Sea food web shift, without ever being told they mattered.
- The lesson: a clean no and a clear yes, read together, describe a slow gradient rather than a sudden break.
The data: a long term record hiding in plain sight
The dataset is called seabirddietDB, built by Anna Krystalli, Agnes Olin, James Grecian and Ruedi Nager, and the repository is MIT licensed while the data itself carries a Creative Commons Attribution 3.0 licence, free to reuse as long as you credit the people who built it. It lives on GitHub. It compiles published and grey literature records of what the ten most common seabird species breeding in the British Isles actually ate, from 1933 to 2017, across 64 colonies including long running monitoring sites like Isle of May and Fair Isle.
Every record already carries a WoRMS AphiaID for both predator and prey species. That single detail matters more than it sounds. AphiaID is the same kind of stable taxonomic key that global databases like GBIF and OBIS use, so this table can be joined to other biodiversity datasets without renaming a single species. That is the unglamorous, essential skill behind almost every real world ecological data project: getting different data sources to speak the same language before you ask them anything.
Turning diet records into a shape a computer can learn from
I have filled enough field notebooks to know what a record looks like before anyone cleans it. Species names written three different ways, a column that means one thing in spring and something else by late summer, counts entered by whoever was holding the clipboard that morning. Someone has to reconcile all of that before a single model runs, and on most projects that someone is you.
Raw ecological data rarely arrives ready for analysis. The first real step was harmonizing the table into a documented, Darwin Core style occurrence schema, the same standard used across global biodiversity databases, so every column has a clear, reusable meaning.
From there, the 2011 usable records (of 2857 total, since not every historic record included a usable frequency value) were pivoted into a colony year by prey taxon matrix. Think of it as a community table, the kind ecologists build from transect or camera trap surveys, except each row is one predator’s diet in one year at one colony, and each column is how often a particular prey group turned up in that diet.
That matrix is the blueprint everything else in this project reads from.
Question one: does the data cluster on its own
The first question was simple. If you hand a computer 84 years of diet composition with no labels attached, does it naturally group into eras or species on its own.
For compositional data like this, bounded frequencies with a lot of zeros, the right tool is not the everyday Euclidean distance most clustering tutorials default to. It is Bray Curtis dissimilarity, the standard in community ecology, paired with average linkage clustering and visualised using non metric multidimensional scaling rather than PCA.
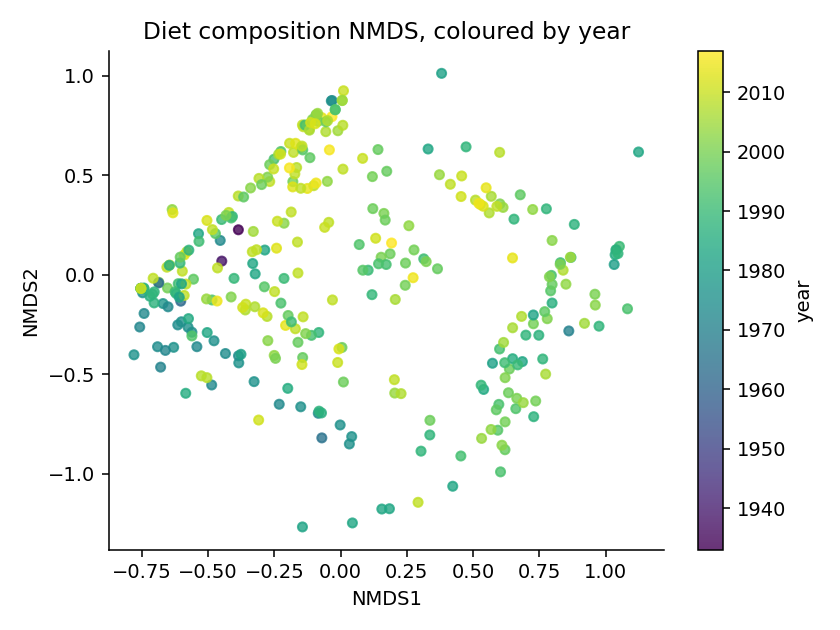
The honest answer was no. The adjusted Rand index between the clusters and known predator species was 0.085. Between clusters and a simple before or after 1990 split, it was 0.006, close to nothing. Left alone, the raw diet composition does not sort itself into tidy groups.
That is not a failed result. It is information. It tells you the shift, if there is one, is not a hard boundary sitting in the data waiting to be found. It is something subtler.
Question two: can a model predict what clustering could not see
So I asked a different, more pointed question. Without telling a model the year or the location, only the diet composition of a sample, can it guess whether that sample comes from before or after 1990.
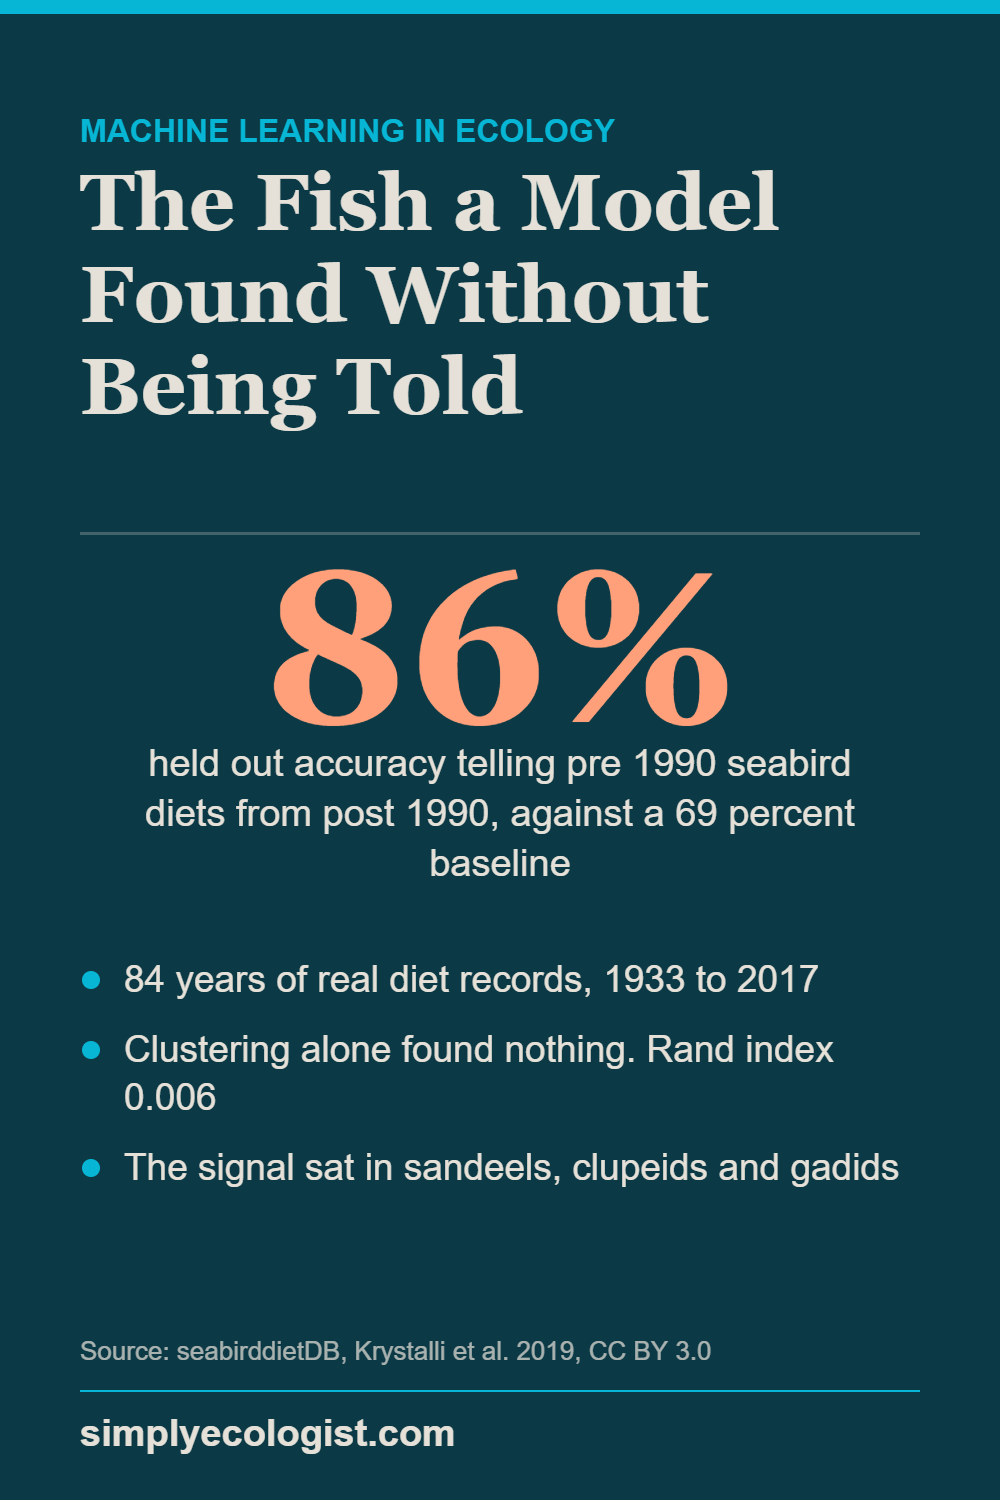
A random forest classifier, the same family of model used across ecology for its resistance to noisy, mostly zero heavy data, answered yes. Held out accuracy reached 86 percent against a 69 percent majority class baseline, with a five fold cross validated ROC AUC of 0.86.
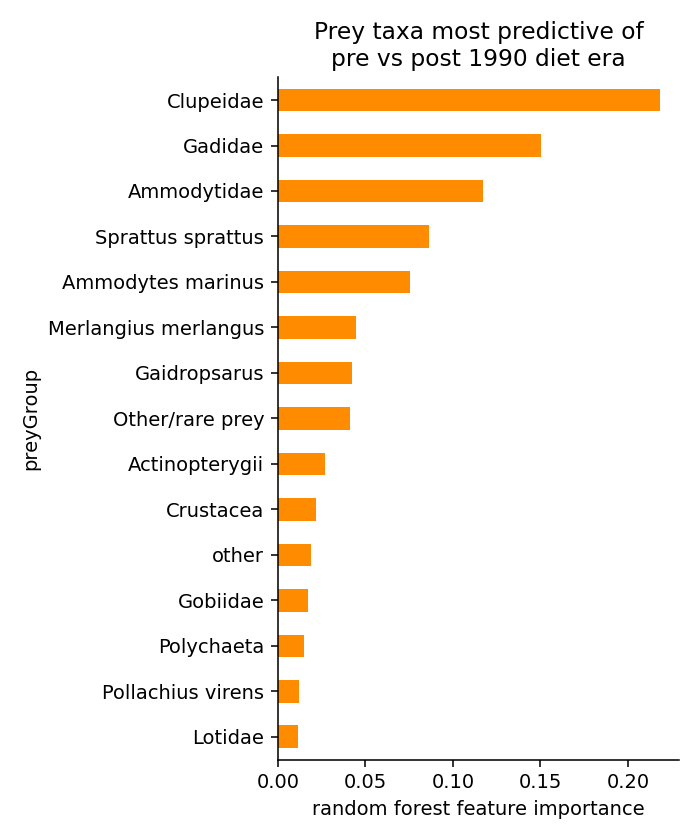
The three prey groups carrying that signal were clupeids (herring and sprat), gadids (the cod family) and sandeels. Those are not random. They are the exact fish at the centre of some of the most well documented community shifts in the North Sea since the late twentieth century, including the so called gadoid outburst and the long, well studied decline of sandeels linked to warming water and fishing pressure.
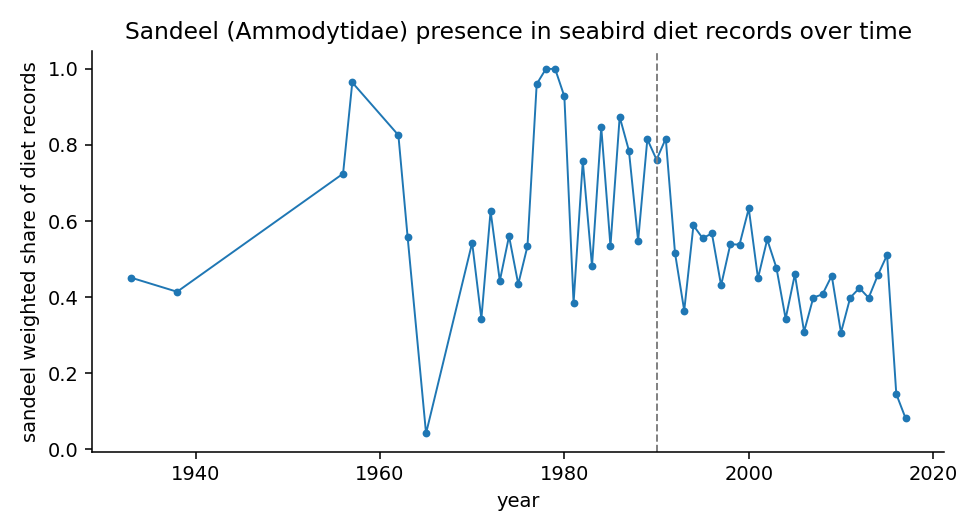
A model with no ecological knowledge, given nothing but raw diet frequencies, rediscovered the exact fish that decades of fisheries science already flagged as the story. That is the kind of result that earns trust, not because the model is clever, but because it checks out against everything else we already know.
What the species can tell you about themselves
A second, gentler question: can diet composition alone tell you which of the eight best sampled seabird species you are looking at.
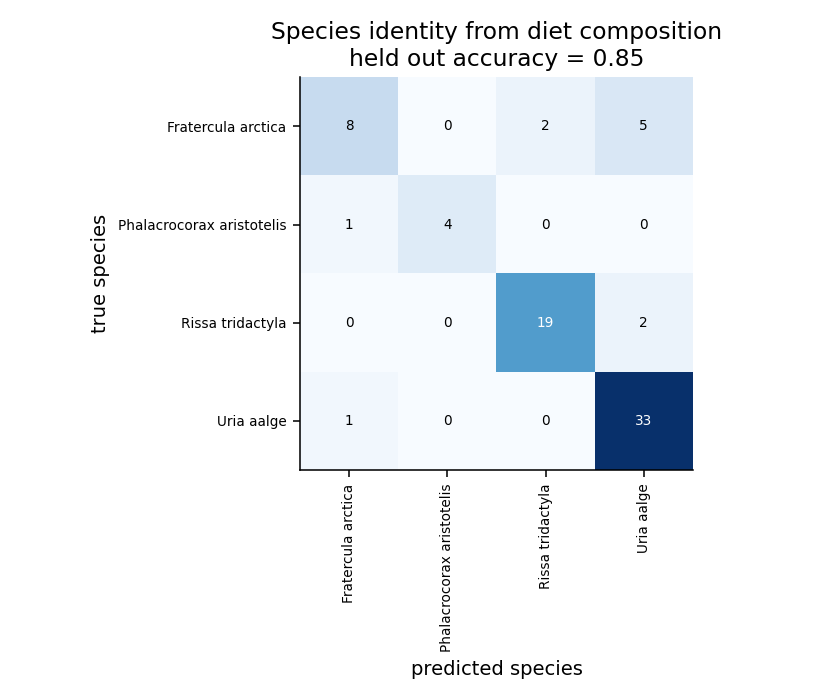
Yes, with 85 percent held out accuracy and sandeels again as the dominant signal, and that lines up with what the literature already says about these birds. The European shag at Isle of May was the textbook sandeel specialist through the 1980s, and the sandeel share of its diet fell by 48 percent between 1985 and 2014 as it spread onto rock butterfish, dragonets and codfishes. Read that way, a model looking only at diet is really reading how far along that road each species has already travelled.
Why this matters beyond one dataset
| Question asked of the data | Method | Result |
|---|---|---|
| Does diet composition sort itself into eras or species on its own | Bray Curtis dissimilarity, average linkage clustering, NMDS ordination | No. Adjusted Rand index 0.085 against species, 0.006 against a 1990 split |
| Can a model tell before 1990 from after 1990 using diet alone | Random forest classifier | Yes. 86 percent held out accuracy against a 69 percent baseline, ROC AUC 0.86 |
| Can diet alone identify which seabird species is feeding | Random forest classifier | Yes. 85 percent held out accuracy, sandeels the dominant signal |
Put the two results side by side and a pattern emerges that says something true about ecological change generally. Clustering could not draw a clean line through 84 years of data. A supervised model, asked a sharper question, found a signal that lines up with documented reality. That combination, a smooth underlying gradient rather than a sudden break, plus a real and detectable ecological fingerprint, is exactly the shape you would expect from a slow moving, decades long shift in a food web rather than a single catastrophic event.
This is also, quietly, a template. Harmonize the data properly, respect the shape of your variables when you choose a method, ask both an unsupervised and a supervised question, and report what you find even when one of those answers is a clean no. That workflow is not specific to seabirds or the North Sea. It is the same one that scales to Arctic monitoring data, to eDNA community composition, to any long running biodiversity record sitting in a repository waiting to be asked the right question.
The limits, stated plainly
This was built in a day as a demonstration of method, not a submitted study, and it deserves the same honesty in the writeup as in the analysis.
The data covers Northeast Atlantic colonies, not Arctic sites. The 1990 split is a simplification chosen for the demonstration, not fitted to a documented shift year, and roughly a third of samples come from one very well sampled colony, Isle of May. No environmental covariates like sea surface temperature or ice extent were used, only the diet signal itself. The unsupervised ordination has a moderate stress value, useful but not a precise two dimensional summary of the underlying distances.
See the full analysis
Every figure here, the full notebook, the harmonized data table and the code are public on GitHub at github.com/elifrey/seabird-diet-ml. It runs end to end from the raw data file with two commands. I ran the same two question approach on a completely different kind of biodiversity data in a companion project on Arctic marine mammal calls, and got the same shape of answer. The harmonized occurrence table and every figure here are mine, released under a Creative Commons Attribution 4.0 licence, so reuse them freely with credit. The analysis code is MIT.
Questions people ask about this kind of project
Do you need a PhD to run a project like this?
No. Everything here uses open, freely licensed data and standard, well documented Python libraries. What it needs is care in matching the method to the shape of the data, and honesty about what the results do and do not show.
What is the actual difference between the unsupervised and supervised parts?
Unsupervised clustering asks the data to sort itself into groups with no labels given. Supervised classification is given a specific question, in this case an era or a species label, and learns to predict it. A dataset can fail the first test and pass the second, which is exactly what happened here.
Can early career ecologists build something like this without a data science background?
Yes, with time invested in the fundamentals. The harder skill is not the model itself, it is understanding your data well enough to choose the right distance measure, the right validation approach and the right way to report a negative result honestly.
Where does data like this come from if I want to try my own version?
Public repositories like GBIF, OBIS and researcher hosted GitHub repositories like this one are full of real, citable, appropriately licensed biodiversity data. The seabirddietDB dataset used here is one example among many.

Erzsebet Frey (Eli Frey) is an ecologist and online entrepreneur with a Master of Science in Ecology from the University of Belgrade. Originally from Serbia, she has lived in Sri Lanka since 2017. Eli has worked internationally in countries like Oman, Brazil, Germany, and Sri Lanka. In 2018, she expanded into SEO and blogging, completing courses from UC Davis and Edinburgh. Eli has founded multiple websites focused on biology, ecology, environmental science, sustainable and simple living, and outdoor activities. She enjoys creating nature and simple living videos on YouTube and participates in speleology, diving, and hiking.
From the shop
Gifts for people who love the wild
Wildlife themed t-shirts, notebooks, tote bags, bandanas and guides, designed by an ecologist.
Visit the shop